
Project finance lending to clean energy technologies grew by 7.6% in the first half of 2025 compared to the same period last year. Our research estimates that more than $86 billion in debt financing went to support both mature technologies such as wind and solar as well as an expanding list of newly eligible and emerging technologies, such as advanced manufacturing, nuclear, clean fuels, and geothermal.
The growth in project lending reflects a growing and maturing market, driven by rapid load growth, investor demand for clean energy project exposure, tax credit availability, and an evolution among lenders to serve more technologies and sponsor types.
Estimated total project finance (all sources) and lending to clean energy, through 1H2025
%20and%20lending%20to%20clean%20energy%2C%20through%201H2025.png)
Clean energy projects utilize several types of capital to fund their development, construction, and operation. These include tax equity, preferred equity, project equity, transferable tax credits, and several varieties of debt financing:
Projects combine these sources of funding into a capital stack. Pricing for each funding source is based on a project’s technology, type, revenue model, and the credit quality of the sponsor.
For debt financing, lenders price loans as a spread over two benchmark rates: the Secured Overnight Financing Rate (SOFR) or five-year US Treasuries. As of September 2025, the SOFR was 4.35% and five-year US Treasuries were 3.73%. The actual spread above these benchmarks varies significantly based on project type.
According to Crux’s mid-year market report, fully contracted, utility-scale solar and wind projects developed by sponsors with established track records can secure construction loans at spreads of just 150 basis points (bps) over SOFR — meaning a total of 5.85%. By contrast, projects with emerging technologies, a merchant revenue model, or sponsors with less experience could expect spreads between 300 and 1,000 basis points.
Get our latest insights and favorite reads on the transferable tax credit market in your inbox.
Pricing trends and drivers related to each loan type varied in the first half of 2025:
According to data from New Project Media, pre-NTP funding surpassed $7 billion in the first half of 2025. One factor driving this level of funding is regulatory changes in the One Big Beautiful Bill (OBBB) that accelerated the timelines developers must follow to maintain eligibility for wind and solar tax credits.
Under the OBBB, wind and solar projects must meet commence-construction requirements before July 4, 2026 to be eligible for the §45Y or §48E tax credit. The legislation likely drove an increase in equipment financing needs for purchases of wind turbines, solar panels, and other equipment.
Pre-NTP development capital costs are shaped in large part by the fact that they come with some inherent risk. Pre-NTP capital finances project steps that must be completed before a project can be built. In the first half of 2025, that meant:
Bridge loans provide short-term financing to cover a project’s capital needs before a range of committed funds — from tax equity and transferable tax credits to preferred equity — become available. This funding is important because tax credit proceeds are only available once projects are operational. Bridge loan types include:
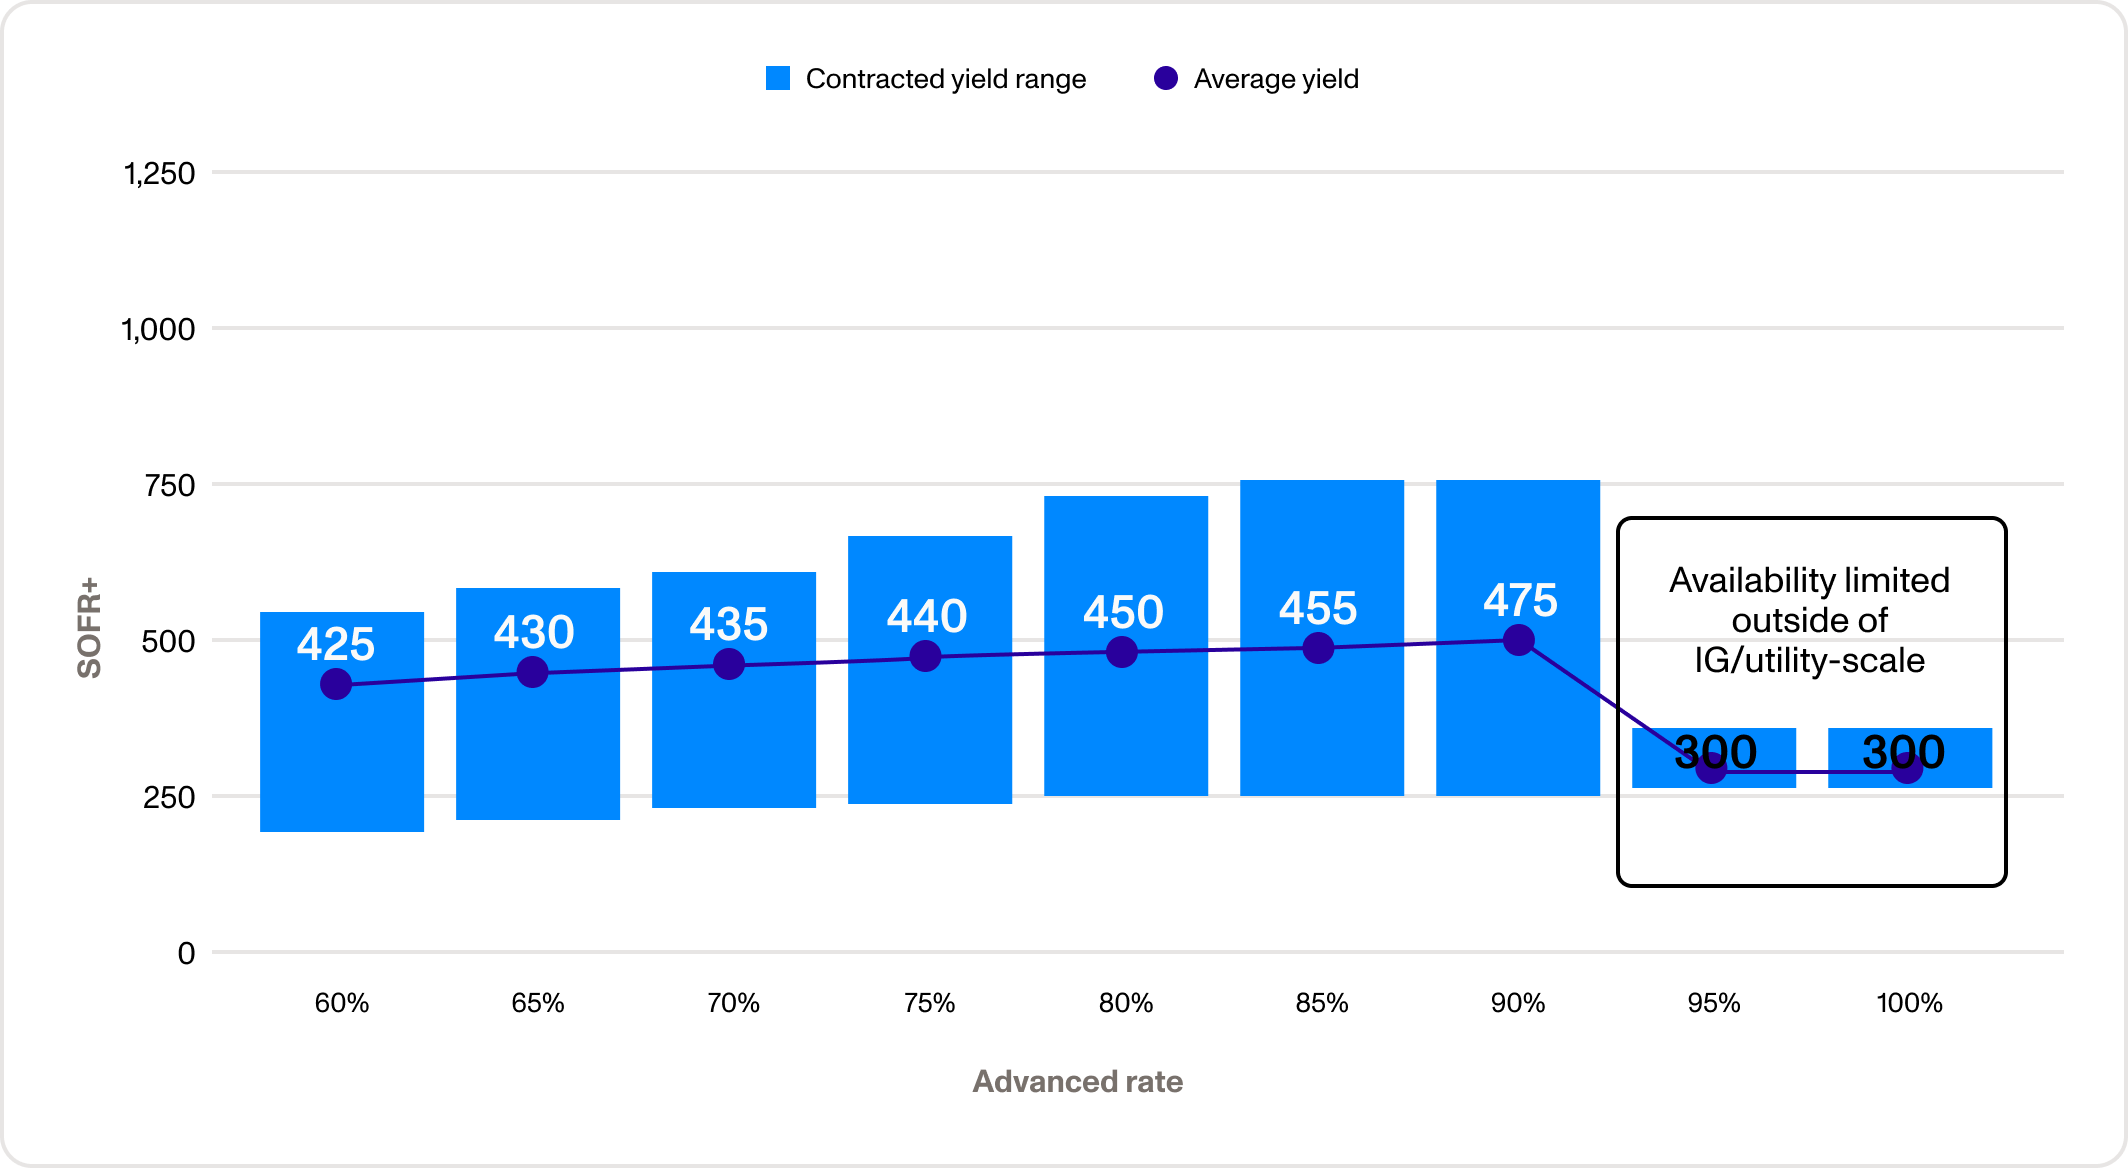
In the first half of 2025, the pricing for bridge loans was most attractive when a firm commitment from an investor was in place. Loans backed by committed tax credit purchase agreements, tax equity term sheets, and preferred equity investments received the most favorable terms. Loan advance rates ranged from between 60% and 98% of expected proceeds, and prices ranged from SOFR + 200 to 750 basis points, with those that had investment-grade counterparties receiving the most favorable terms.
Range of committed bridge loan yield by advance rate
The perceived higher risk of uncommitted projects was reflected in pricing. Uncommitted bridge loan pricing ranged between SOFR + 500 and 1,000 basis points. Advance rates were also lower, at between 60% and 90% of expected proceeds.
Advance rates for uncommitted bridge loans

Construction debt provides the capital needed to transform blueprints, permits, interconnection agreements, and other development activity into power plants generating electricity and factories manufacturing clean energy components.
Construction loans are short-term loans and cover the financing needs from groundbreaking until commercial operations. Construction loan dynamics in the first half of 2025 were characterized by:
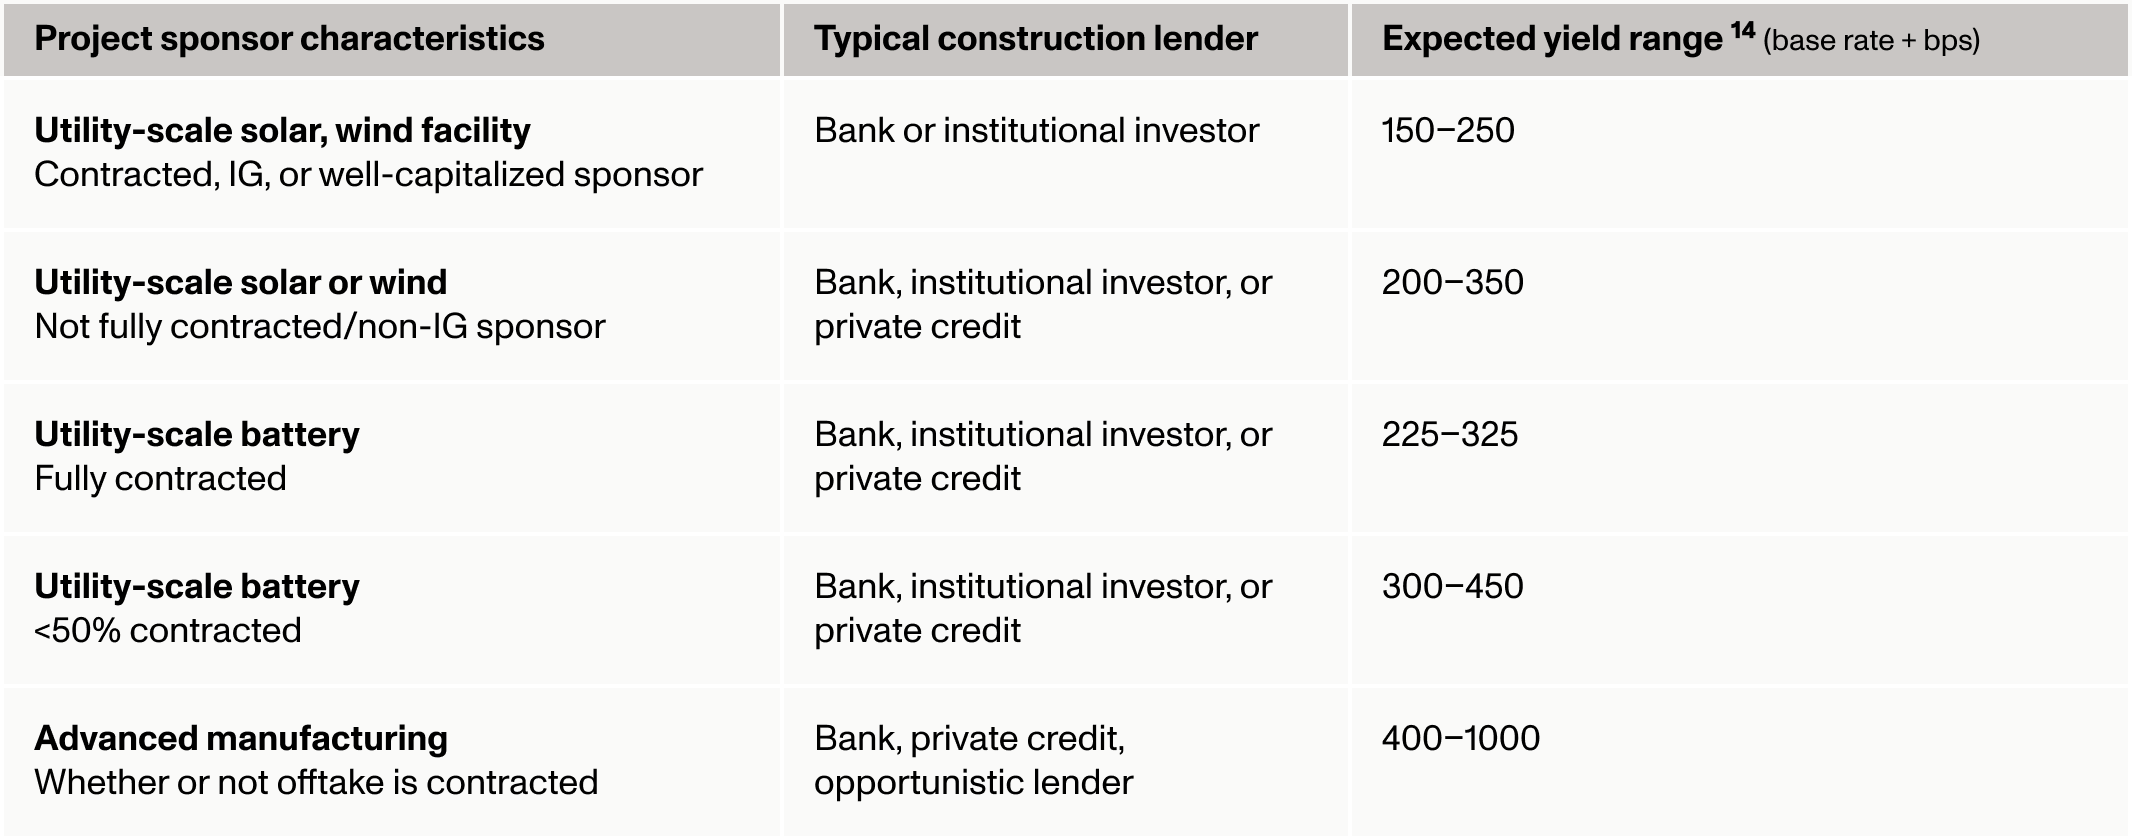
Representative construction yield ranges for energy and manufacturing projects
Term debt provides funding once a project begins operation. Term debt replaces construction loans and can lock in longer-term, lower-cost capital while also enabling developers to recycle capital to invest in new projects.
Term debt is the cheapest source of capital in the project finance debt stack. Pricing is driven by offtake agreements and the credit profile of borrowers:
Go deeper: Download “Financing the Future: Lending Dynamics in US Energy and Manufacturing”
All things being equal, the lending market in the first half of 2025 was more liquid for fully contracted projects given the reduced risk associated with cash flow predictability. Over time, however, lenders have shown more willingness to allocate capital to partially contracted projects due to increased investor sophistication around project end-markets and technological maturity.
The growth and liquidity of the tax credit market has also helped lenders underwrite loans to projects with merchant revenues, reflecting confidence that the tax credit can be monetized at a reasonably predictable price. However, capital allocated to invest in merchant projects is typically at a lower total dollar volume and higher cost compared to that for fully contracted projects.
Crux’s full market intelligence updates — including deeper explorations of trends in the debt and tax equity markets and tax credit pricing by technology types — are available exclusively to Crux clients. Contact us to learn more about accessing our market insights and technology-enabled debt capital markets platform.